40% off TNW Conference!
Now, lets first understand the data, our goals and then, Ill move to the visualizations.
Check out the following to understand:
Lets get cracking then.
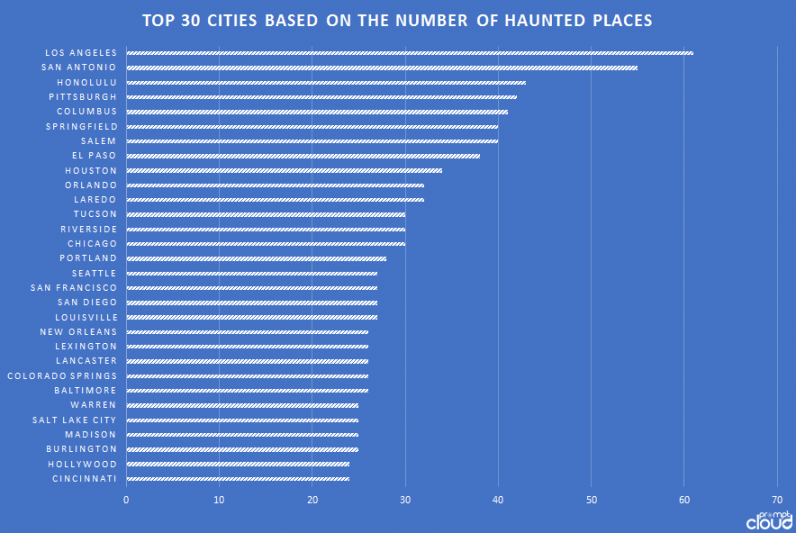
Specifically, Hollywood has 25 references and Universal Studio features twice in this list.
So be careful out there.
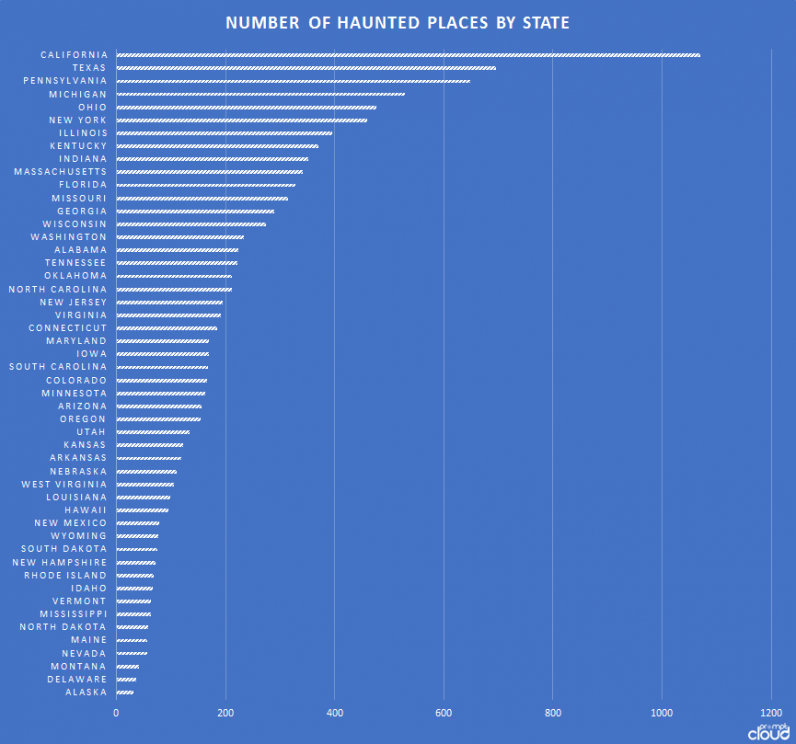
Most haunted states
Lets now find out the number of haunted places for each state.
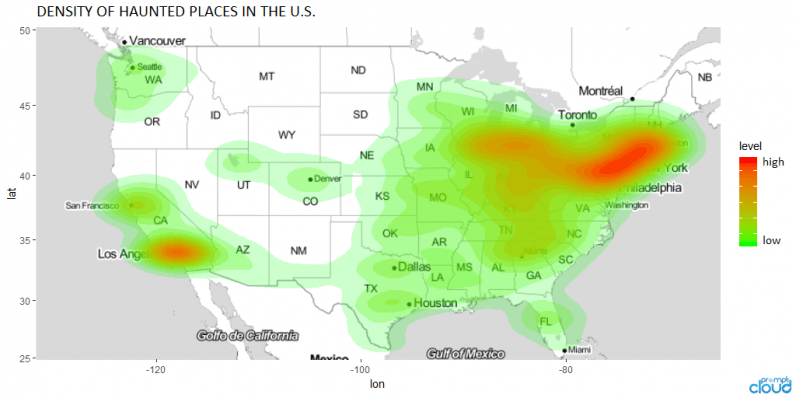
However, visualizing the data on a map adds further clarity.
Oh wow, this is really scary.
Now its clearwherespooky things happens, buthowis it spooky?
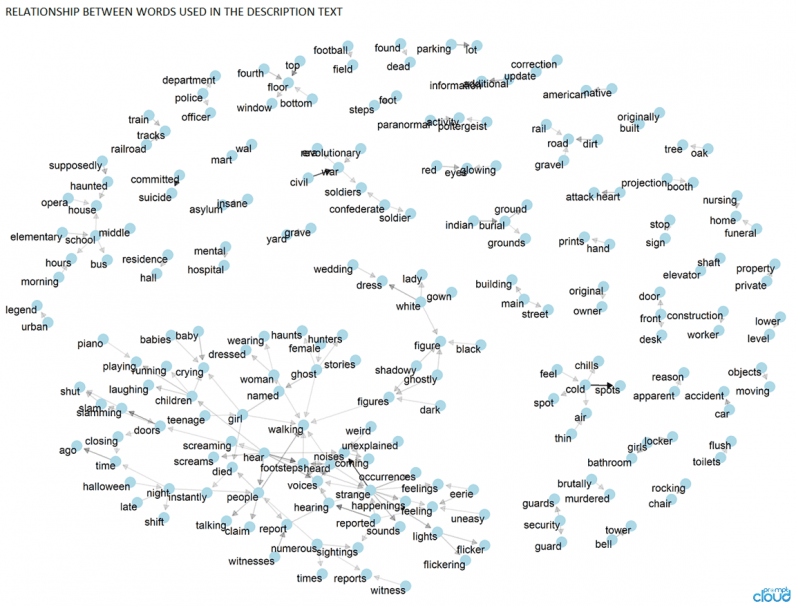
Ill take the help oftidy data frameworkfor text mining via R to produce the visualization.
Bi-grams are particularly interesting since they allow analysis of sequence of words and their underlying connections.
This internet graph shows some interesting connections.
For instance, theres a cluster of words related to soldiers and civil war.
Close by are the words wal and mart I wonder what they mean…
Interesting to note that at the top the word poltergeist (noisy ghost) is associated with paranormal activity.

This makes sense because apparently they are capable of pinching, biting, hitting, and tripping people.
Poltergeists are also associated with levitation of objects which definitely counts as paranormal activity.
Conclusion
This sums up our little Halloween voyage via data visualization.
We saw that California is the spookiest state which houses the spookiest city, i.e., Los Angeles.
Apart from that we uncovered the frequently used words and their underlying connections.
Now its time for you to carve a pumpkin and study this article intensely for your Halloween party talking-points!
Story byPreetish Panda
Preetish Panda manages marketing at PromptCloud, a Bangalore-based data-as-a-service provider.
He is passionate about convergence of technology, marketing, and analytics.
