The choice of color to represent information in scientific images is a fundamental part of communicating findings.
A color map is a palette of multiple different colors that assign values to regions on a plot.
40% off TNW Conference!
Fundamentally, the change between the colors in the palette is not smooth.
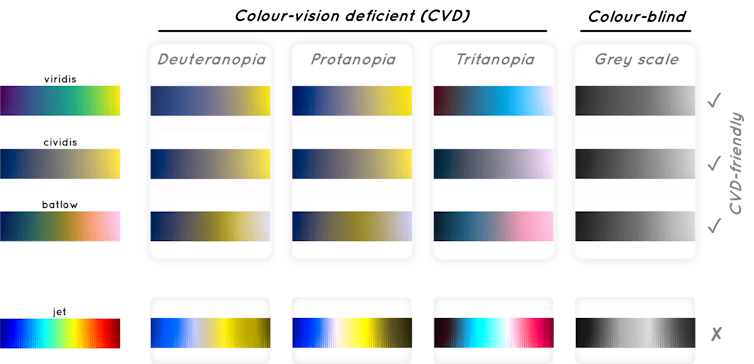
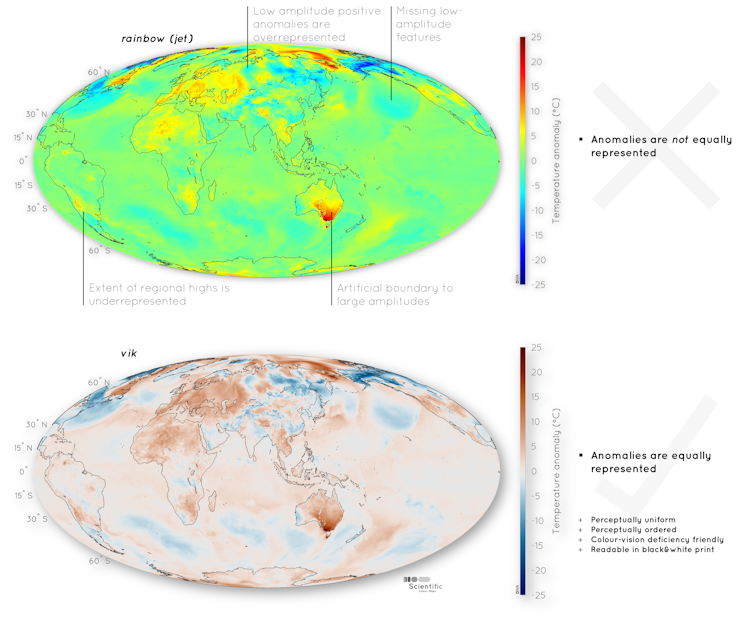
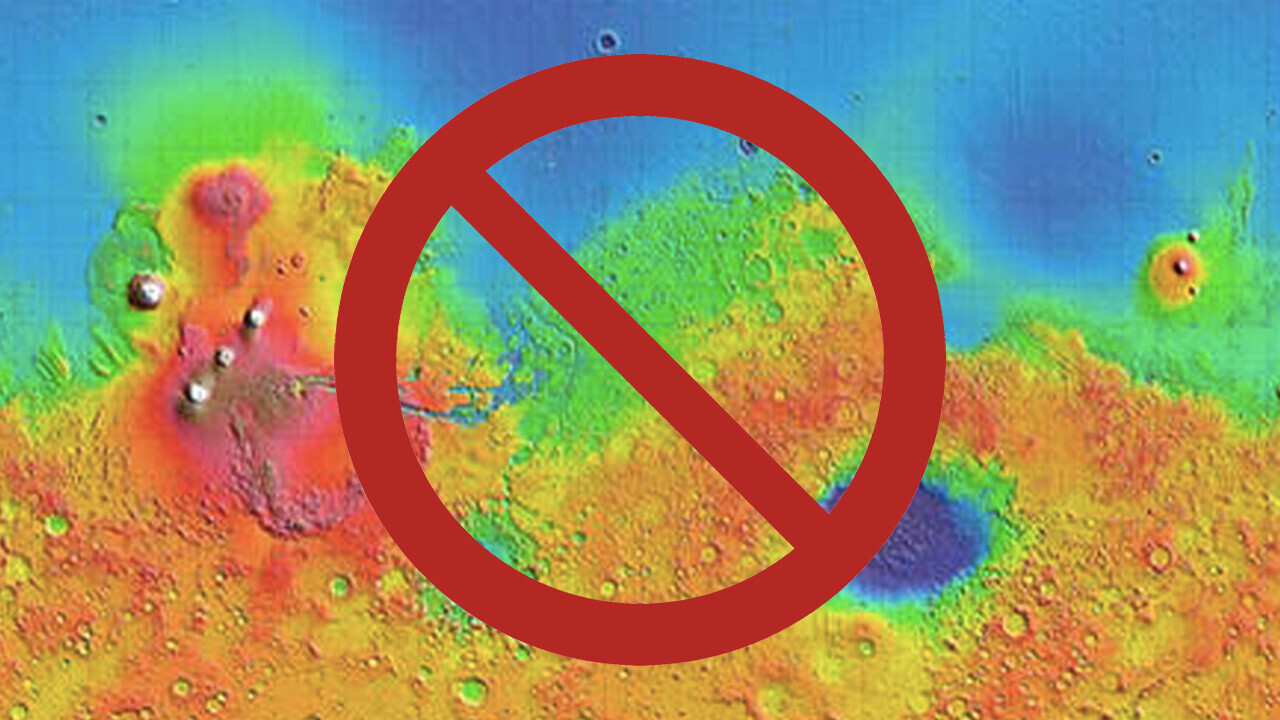
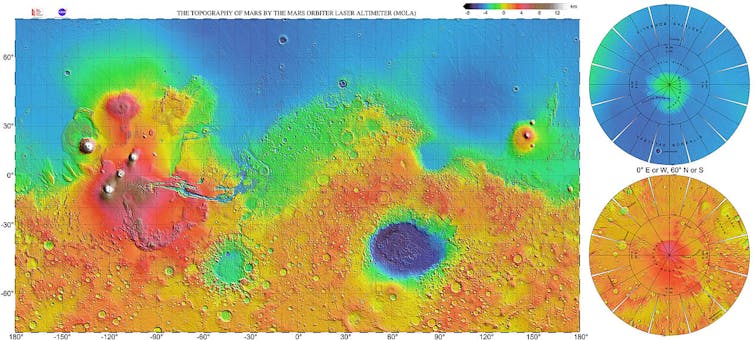
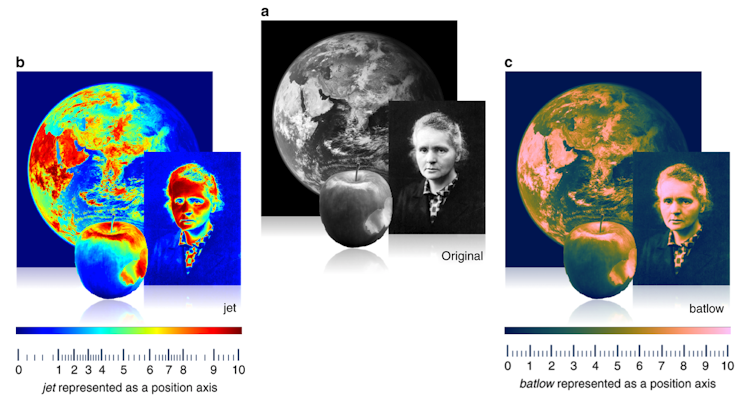
Rainbow, the most-widely used color map, doesnt produce a smooth gradient and is not universally readable.
There is growing recognition of the challenges associated with rainbow palettes.
Some academic publications likeNature Geoscience have adopted a more even color palette policy for new submissions.
The Intergovernmental Panel on Climate Change hascolor-blind friendly guidelines for figures.
Software packages such as MATLAB and Python have removedrainbowas their default colour palette for data visualization features.
Accessible science for all starts with moving away from defaults.
Also tagged with