But can we attribute this to anything more natural than anthropogenic effects?
Solar activity, for example,has previously been linkedto temperature and issometimes blamedfor climate change.
But our new analysis provides evidence for why this isnt the case.
It’s free, every week, in your inbox.
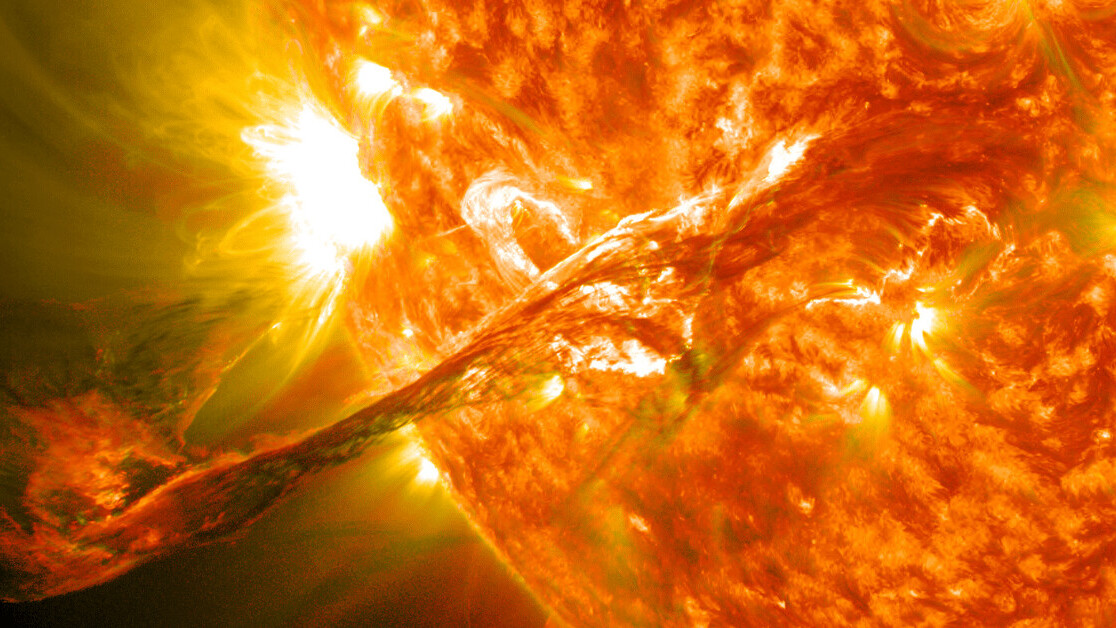
Like all stars, the sun undergoes variations in solar activity, meaning its energy output varies with time.
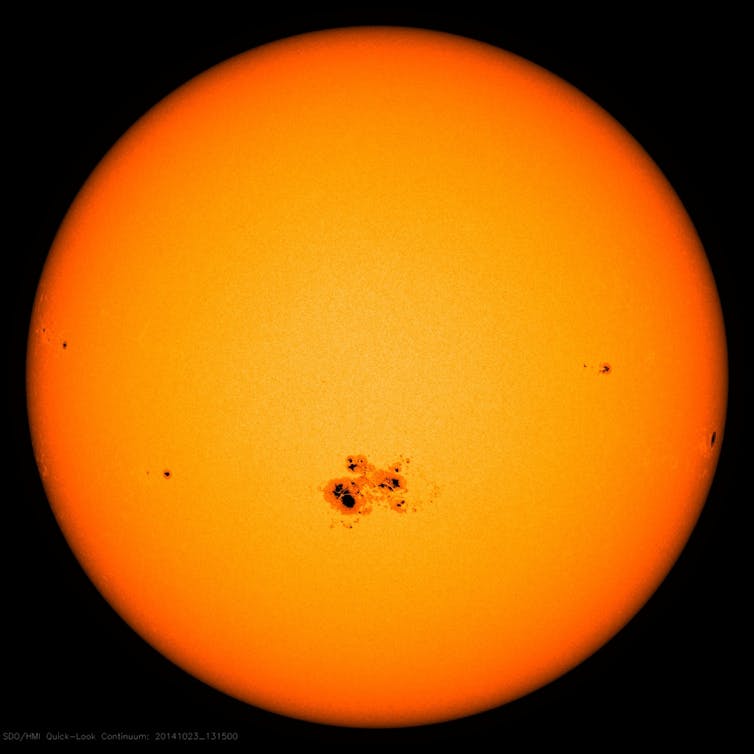
The visible surface of the sun (which you should never look at directly) is called the photosphere.

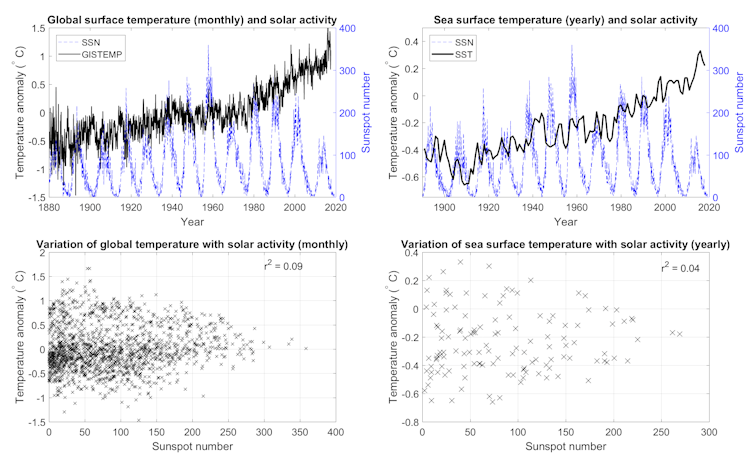
Graphs showing change in temperature as a function of year or number of sunspots.
When imaged, it appears as a white disk which is occasionally blotted by the appearance of sunspots.
However, these same intensemagnetic fields connectthe visible sunspots on the photosphere with active regions we cant see.
These are areas of gas thousands of kilometers above the visible surface that are superheated to millions of degrees.
Such active regions emit light very strongly inultra-violet and x-ray radiation.
The more sunspots, the more solar activity, and hence the greater overall emission of ultra-violet and x-rays.
Like our planet, the sun also has a magnetic field that extends outwards.
Largest sunspot of the solar cycle, seen on Oct. 18, 2014.
NASA
The number of sunspots rises and falls as part of a roughly 11-yearsolar activity cycle.
The solar magnetic field also varies in strength with this solar cycle.

It is weakest at solar minimum and strongest at solar maximum.
Our current cycle
Some of the earliest scientific sunspot observations were made byGalileo Galilei in the 1610s.
From the 1700s, such observations became more regular.
They constitute one of the longest historically continuous data sets in all of science.
The most recent is solar cycle 24, whichofficially beganin December 2008 and is still ongoing.
We are rapidly approaching the next solar minimum, which is expected in the next year or so.
Solar cycle 24 is unusually weak, with a relatively low number of sunspots, compared to previous cycles.
The last one this weak was solar cycle 14, which began in January 1902.
Apaper from 2012even predicted there would be a 1.0C decrease in temperatures.
Clearly this has not turned out to be the case.
The hottest decade on record has coincided with the weakest solar cycle for over a century.
The top panels show the warming trend and sunspot number over time.
The divergence between sunspot number and temperatures is particularly apparent in the most recent solar cycle.
