At the time of writing, the infographics are still available and no further explanation has been offered.
Its a nice idea but, unfortunately, its practically useless.
For starters, the choice of one to five scale is quite arbitrary.

It is when you analyze the graphs and equation behind it that things get murky.
Sadly, the equation is nonsense for a number of reasons.
To understand why, lets consider something we call units.
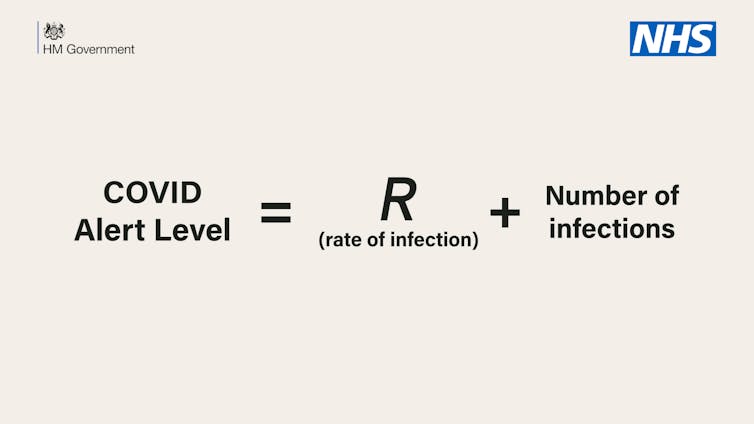
The governments equation to explain its alert levels.
You may have been asked by your maths teacher to put units on your answers.
For example, an answer to a problem may be three apples, three metres, or three years.
This underlines the fundamental mistake of the governments equation, which links the following three parameters.
You would want such an alert level to be based on these factors.
However, you cannot simply add them up.

You cant add units of people per day plus people and get a unitless number between one and five.
Mysterious graph
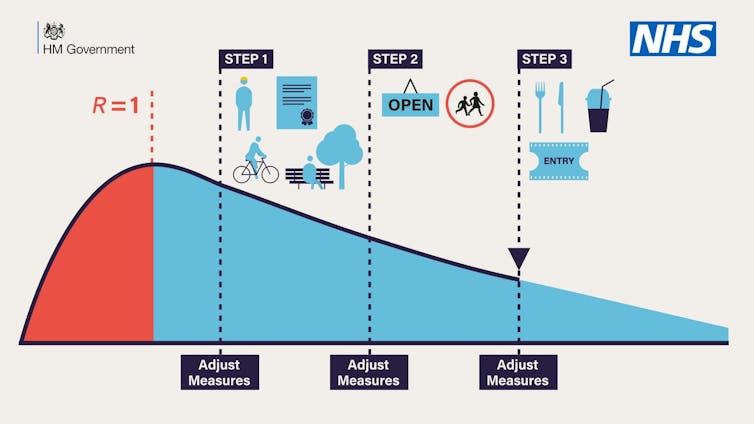
Now lets move on to the graph below, presenting information about the lockdown steps.
Here, we see a humped curve that slowly decreases and suggests steps to ease lockdown along the way.
Graph showing how to ease the lockdown.
Whats more, the vertical (y-axis) and horizontal (x-axis)components of the graphare not labelled.
So what information is the graph presenting?
It seems a safe assumption that the x-axis is time.
But is it days, months, or years?
Since there is no key, interpretation of what the red and blue mean is fraught with problems.
And what is the y-axis?
But why choose to plot R and not something more understandable, say the number of cases?
Equally, the lockdown was enforced due to R becoming larger than one.
Again this confuses the audience as to what R means.
This article is republished fromThe ConversationbyThomas Woolley, Lecturer in Applied Mathematics,Cardiff Universityunder a Creative Commons license.
